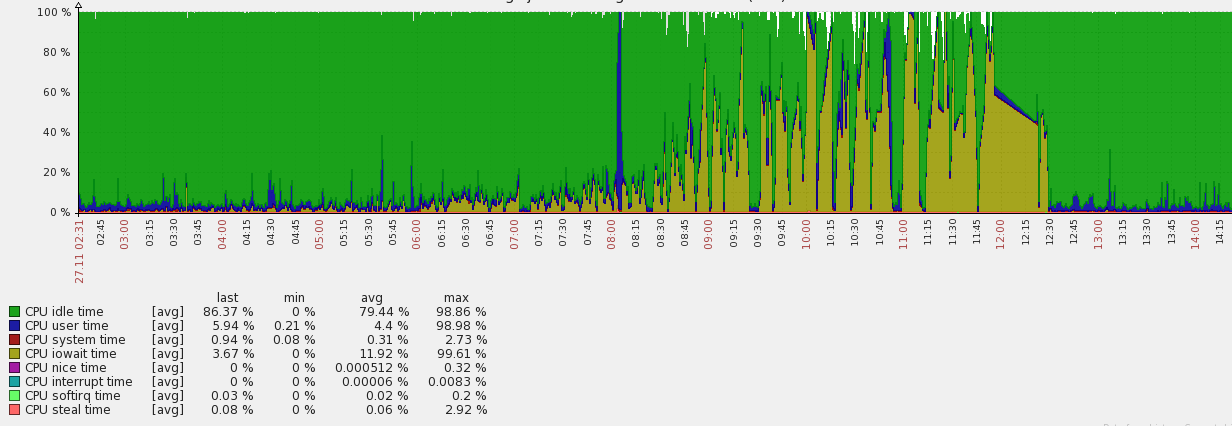
Last friday, while working on something else (working on "CentOS 7 userland" release for Armv7hl boards), I got notifications coming from our Zabbix monitoring instance complaining about web scenarios failing (errors due to time outs) , and also then also about "Disk I/O is overloaded" triggers (checking the cpu iowait time). Usually you'd verify what happens in the Virtual Machine itself, but even connecting to the VM was difficult and slow. But once connected, nothing strange, and no real activity , not even on the disk (Plenty of tools for this, but iotop is helpful to see which process is reading/writing to the disk in that case), but iowait was almost at 100%).
As said, it was happening suddenly for all Virtual Machines on the same hypervisor (CentOS 6 x86_64 KVM host), and even the hypervisor was suddenly complaining (but less in comparison with the VMs) about iowait too. So obviously, it wasn't really something not being optimized at the hypervisor/VMS, but something else. That rang a bell, as if you have a raid controller, and that battery for example is to be replaced, the controller can decide to stop all read/write cache, so slowing down all IOs going to the disk.
At first sight, there was no HDD issue, and array/logical volume was working fine (no failed HDD in that RAID10 volume), so it was time to dive deeper into analysis.
That server has the following raid adapter :
03:00.0 RAID bus controller: LSI Logic / Symbios Logic MegaRAID SAS 2108 [Liberator] (rev 03)
That means that you need to use the MegaCLI tool for that.
A quick MegaCli64 -ShowSummary -a0 showed me that indeed the underlying disk were active but I got my attention caught by the fact that there was a "Patrol Read" operation in progress on a disk. I then discovered a useful (bookmarked, as it's a gold mine) page explaining the issue with default settings and the "Patrol Read" operation.
While it seems a good idea to scan the disks in the background to discover disk error in advance (PFA), the default setting is really not optimized : (from that website) : "will take up to 30% of IO resources"
I decided to stop the currently running patrol read process with MegaCli64 -AdpPR -Stop -aALL and I directly saw Virtual Machines (and hypervisor) iowait going back to normal mode.
Here is the Zabbix graph for one of the impacted VM, and it's easy to guess when I stopped the underlying "Patrol read" process :

That "patrol read" operation is scheduled to run by default once a week (168h) so your real option is to either disable it completely (through MegaCli64 -AdpPR -Dsbl -aALL) or at least (adviced) change the IO impact (for example 5% : MegaCli64 -AdpSetProp PatrolReadRate 5 -aALL)
Never understimate the power of Hardware settings (in the BIOS or in that case raid hardware controller).
Hope it can help others too
